Between the centre and the periphery: The demographic profile of Lithuanian Poles

The Polish population in Lithuania is shrinking year by year as a result of demographic processes affecting the entire local population. Both the Polish minority and the Lithuanian majority face similar challenges, such as declining birth rates and an ageing population.
Changes within the Polish diaspora may seem minor at first glance, and the proportion of Poles living in Lithuania remains relatively stable at around 6.5%. However, due to the rapidly growing population of the capital’s metropolitan area, the proportion of individuals identifying as Polish will gradually decline, particularly in the Vilnius District. In the long term, this trend will have consequences for the political and social life of Lithuania’s Polish community, further weakening its position as a cohesive electorate.
The statistics are similar for Poles and Lithuanians
Over the past 35 years, Lithuania’s population has declined from 3.6 million to 2.8 million (according to the most recent 2021 census), a decrease of 22%. Demographic statistics indicate that trends within the Polish community differ only slightly from those observed in the wider Lithuanian population. In 1989, approximately 258,000 Poles lived in Lithuania; by the 2021 census, this figure had fallen to 183,000, representing a decline of around 29%.
Table 1. Poles in Lithuania according to official statistics
Source: Official Statistics Portal.
The Polish minority in Lithuania primarily resides in the Vilnius metropolitan area and its surroundings, including the city of Vilnius and the districts of Vilnius, Šalčininkai, Trakai, and Švenčionys. Approximately 91.5% of Lithuania’s Polish population resides in this region.
Table 2. Proportion of Poles in densely populated districts in 2021
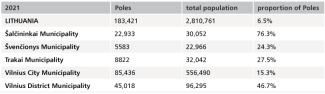
Source: Official Statistics Portal.
The main demographic trends among Lithuania’s majority population and the Polish minority are quite similar, in contrast to the Russian or Belarusian minorities in Lithuania, which have migratory origins. There are no significant differences between Lithuanian Poles and ethnic Lithuanians in terms of migration, fertility, or mortality rates. These similarities stem from the settlement structure, which is predominantly indigenous.[1] One demographic factor that distinguishes Poles from Lithuanians is the rate of ageing. In the coming years, this process is expected to advance slightly faster among Poles, as indicated by their age structure (see Chart 1). The proportion of pre-working age individuals in the Polish population is lower than in the ethnic Lithuanian population (16% compared with 20%). In the working-age group (62% vs. 60%) and post-working age group (approximately 20% vs. 19%), the difference is almost negligible. The age distribution of the Polish population reflects the effects of a demographic boom, which is evident in the relatively large cohort of individuals aged 40 and older.[2]
Chart 1. Population age pyramids for Lithuanians, Poles, and Russians in 2021
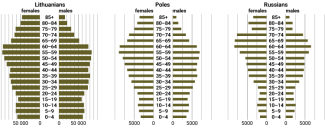
Source: the author’s own calculations based on figures available at the Official Statistics Portal.
The socio-economic situation and state policy
The socio-economic situation of Poles in Lithuania, particularly in the early years of independence, was worse than that of their Lithuanian neighbours. Several factors contributed to this, some representing the legacy of the Soviet era and others arising from the policies implemented by the Lithuanian state. At the time, Poles in Lithuania were predominantly a rural, post-collective farm population and were often less educated than other ethnic groups. Their situation was further exacerbated by the land restitution process of the 1990s, which largely disregarded their interests. A crucial factor was the loss of opportunities to reclaim property in the capital, Vilnius, leading to systemic economic inequalities and pauperisation.[3] Another key barrier that marginalised Lithuanian Poles and hindered their social advancement in the 1990s was their lack of proficiency in the state’s official language.
In addition to economic policies that adversely affected the Polish population, the concept of ‘Lithuanianness’ played a dominant role in shaping citizenship in the newly independent state. Consequently, the state pursued social integration through top-down ‘Lithuanisation’, which involved expanding the presence of the national language while restricting the public space in which minority languages could function.
For many years, another issue has been the negative portrayal of Lithuanian Poles, reinforced in part by state media, which constituted a form of symbolic violence,[4] by the Lithuanian majority and the state. A notable example is the television programme ‘Dviračio žinios’,[5] in which Poles are depicted as religious, narrow-minded provincials, draped in Polish national symbols. Another stereotype that has gained prominence in the past decade is the belief that the Polish minority holds widespread pro-Russian or pro-Belarusian views.[6]
Despite systemic inequalities, the situation of Lithuanian Poles has gradually improved over time. One indicator of this progress is the educational attainment of the population. Among the younger generation, there has been a steady increase in the proportion of individuals with a university degree;[7] young Poles are increasingly graduating from universities and advancing socially,[8] and – unlike older cohorts – no longer struggle with the lack of proficiency in the Lithuanian language. This improvement is also reflected in statistics from the Šalčininkai Municipality, the most economically disadvantaged and socially excluded region, which is also the most ‘Polish’ in Lithuania. Between 2001 and 2021, the number of residents with higher education nearly doubled, from 2,263 in 2001 to 4,215 in 2021. At the same time, the number of people with only primary education has fallen by more than half. Official statistics also indicate that there are no longer any individuals without formal education.[9]
Vilnius’s urban sprawl
Over the past four years, Lithuania’s three largest conurbations–Vilnius, Kaunas, and Klaipėda–have experienced rapid population growth, driven primarily by increased internal and external migration. The most significant growth has been recorded in the capital’s metropolitan area.[10] Between 2021 and 2024, the population of the Vilnius City Municipality increased by approximately 45,000. The surrounding districts (municipalities) of the capital are also expanding rapidly, primarily due to internal migration. These trends are reshaping the demographic composition of the Vilnius metropolitan area, particularly impacting the proportion of Lithuanian Poles, which is expected to decline more rapidly than would be predicted by stable (and negative) natural population growth rates.
Table 3. Change in the number of Lithuanian Poles in specific administrative districts

Source: Official Statistics Portal.
Table 4. Change in the number of residents of Lithuania’s ‘Polish districts’ from 2020 to 2024
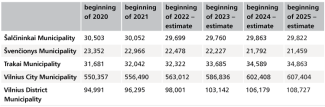
Source: Official Statistics Portal.
Since the 2021 census, the population of the fastest-growing Vilnius District Municipality has increased by approximately 11–12%, rising from 96,000 to 108,000 by 1 January 2025. A similar trend has been reported by the Centre of Registers (Registrų Centras), which estimates the current population at 118,000, up from 106,000.[11]
The actual scale of migration to the district appears to be considerably larger. This is evidenced by the negative natural population growth and the fact that some new residents are not officially registered. Over the past three years, approximately 17,000 individuals may have moved to the area.[12] For comparison, between the 2011 and 2021 Censuses, the population of the Vilnius District Municipality increased by only 1,500.
The recent population growth in the Vilnius District Municipality is equivalent to the emergence of a medium-sized town each year. For example, according to the 2021 census, the population of Nemenčinė, the district’s largest urban centre, was approximately 4,800. As detailed statistics are not publicly available, it is difficult to determine exactly which social and ethnic groups are migrating to the capital’s suburbs. However, considering broader European economic trends, it is likely that a significant portion of the newcomers are ethnic Lithuanians from the so-called middle class.
The profile of the Vilnius District Municipality is changing most rapidly in the elderships located near the city’s borders. This process follows previous trends and is likely most pronounced in the northern elderships, which border Vilnius City’s rapidly developing neighbourhoods,[13] followed by those in the south and east. The popularity of these suburban areas is driven by the ease and convenience of commuting to the city centre.[14]
Chart 2. Net migration to the Vilnius District Municipality
Source: the author’s own calculations based on figures available at the Official Statistics Portal.
The influx of new residents into the Vilnius District Municipality and the accelerating process of semi-urbanisation will have a significant impact on the electoral potential and educational prospects of Lithuania’s Polish community.
Table 5. Individuals eligible to vote in elections in the Vilnius District Municipality
Source: estimates based on figures published by the Central Electoral Commission of the Republic of Lithuania, vrk.lt.; P. Sobik, ‘Akcja Wyborcza Polaków na Litwie w systemie politycznym Republiki Litewskiej’, Wojnowice 2017.
Regardless of factors such as political disenchantment, voter apathy, and shifting party loyalties, the increasing number of eligible voters in the Vilnius District Municipality has undermined the position of Poles as a cohesive electoral group. The first signs of this shift were evident in the 2023 local election when the Vilnius District Municipality, which had been led for the previous 30 years by a representative of the Electoral Action of Poles in Lithuania – Christian Families Alliance (LLRA–KŠS; AWPL–ZChR [Polish]), elected Robert Duchniewicz, an ethnic Pole and vice-chairman of the Social Democratic Party of Lithuania, as mayor. His victory would not have been possible without significant support from the northern elderships, which are increasingly inhabited by ethnic Lithuanians.[15]
The growing number of voters is already influencing the organisation of single-member constituencies in parliamentary elections. This was adjusted in the most recent election compared with that held in 2020. If current migration trends continue, another revision may take place in four years, leading to structural changes in the electorate regardless of shifting public sentiment.
The influx of new residents into the Vilnius District Municipality could, in the coming years, lead to a slight increase in birth rates among Lithuanian families. Consequently, the demand for more educational institutions offering instruction in the Lithuanian language may increase.
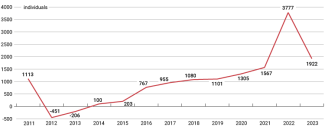
Chart 3. Number of births by region, 2011–2023
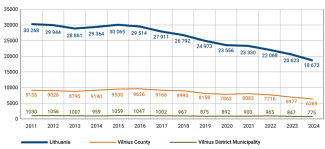
Source: Official Statistics Portal.
According to figures compiled by the national statistical office, the number of children born in the capital’s metropolitan area has remained relatively stable. In recent years, only a slight increase was recorded in 2021 and 2022, which was likely a temporary occurrence. Over a 10–15 year period, despite relatively favourable birth rate indicators in the metropolitan area, where nearly a third of all children in Lithuania are born,[16] a downward trend is evident. In the longer term, if current migration trends persist and intensify, even if the overall number of births remains stable, Lithuanian children are likely to constitute a growing proportion of the population. As the demographic structure of the youngest residents shifts, the number of students choosing Polish-language education may decline. In the long run, this will likely spark debates about the financial viability of maintaining Polish-language educational institutions.[17]
Summary
In the coming decades, a gradual decline in the number of Poles in Lithuania is to be expected. Based on estimates (as the Lithuanian national statistical office does not publish specific indicators) derived from an analysis of the population age pyramid, it can be assumed that over the next 10–15 years, the decline will be steady and consistent with the current trend. However, the decline is likely to accelerate significantly around 2040, when the post-war baby boom generations begin to pass away. At the same time, if the current rise in immigration from third countries continues and Lithuania’s total population starts to grow, the proportion of Poles in the overall population is expected to decline even more rapidly.
The biggest challenge will be the ageing and eventual decline of the Soviet-era baby boom generation (those aged 50–60 according to the 2021 population age pyramid) and the gradual ageing of the late-1980s generation. Over the next two decades, the age pyramid of Lithuania’s Polish population will gradually ‘flatten’ and increasingly resemble the current age structure of, for example, Lithuanian Russians.[18] This shift means that socio-political issues related to education will become more pronounced. A shortage of students, the growing trend of Polish families enrolling their children in Lithuanian-language schools, and the natural process of Lithuanisation will reinforce Lithuania’s policy of closing and ‘optimising’ minority-language schools.
In recent years, social and demographic processes in the Vilnius metropolitan area have accelerated, resulting in lasting changes to the demographic structure of the Vilnius region. The expansion of the capital’s metropolitan area, suburban migration, and the semi-urbanisation of the Vilnius District Municipality are reshaping its ethnic and socio-economic landscape. Elderships that have traditionally been predominantly Polish will gradually experience Lithuanisation, transforming into mixed Polish-Lithuanian areas. This shift will have a profound impact on the region’s social, political, and cultural life.
Alongside immigration, social inequalities, which at times follow ethnic lines, are expected to increase. Ethnic Lithuanians purchasing property in the rapidly expanding suburbs of Vilnius are more likely to belong to higher-income groups than the current residents of suburban elderships, who are predominantly members of national minorities. Structural changes in the local electorate will also take place. In peripheral districts such as Švenčionys Municipality, rapid depopulation is already underway due to high mortality rates and an ageing population. In the semi-peripheral Šalčininkai Municipality, however, depopulation is more closely linked to emigration towards the Vilnius metropolitan area rather than negative natural population growth.
[1] Poles and Lithuanians reside in urban, rural, and mixed areas, unlike other ethnic groups which migrated to Lithuania. Russians and Belarusians are more likely to reside in urban areas.
[2] According to 2021 figures, the median age of the ethnic Lithuanian population is 45 years, while that of the Polish population is 48 years.
[3] Pauperisation is a social process involving the deterioration of living standards for individuals or entire communities. The exclusion of Poles from the land restitution process in Vilnius during privatisation placed them at an economic disadvantage in independent Lithuania relative to the rest of society. Additionally, rural areas inhabited by the Polish minority, such as the Šalčininkai Municipality , are statistically poorer and rank among the regions most at risk of poverty.
[4] This phenomenon, described by sociologist Pierre Bourdieu, occurs when the dominant culture is imposed on a minority while simultaneously discrediting the cultural heritage of the weaker group. In Lithuanian stereotypes, Poles are often portrayed as conservative provincials and culturally backward.
[5] A Lithuanian satirical programme that has been broadcast since the 1990s, airing for 30 years on various Lithuanian television channels. It is currently part of the programming schedule of Lithuania’s state broadcaster. The format consists of satirical sketches resembling a news broadcast, addressing current domestic political issues.
[6] Despite the lack of comprehensive sociological studies, it is evident that pro-Russian attitudes occur within the Polish community in Lithuania. However, not only Poles support them; similar sentiment can also be found among ethnic Lithuanians and other national groups living in Lithuania. It would be incorrect to assume that such views are representative of the entire Polish minority. They are largely driven by distrust of the Lithuanian state and its elites, influenced by the trauma of the 1990s and nearly three decades of missteps in Lithuania’s integration policies. For more see E. Mokrzecka, ‘„Atrodo kaip gerovės valstybė“ – kodėl Lietuvos lenkai palankiau nei rusai žiūri į Rusiją ir Baltarusiją’, LRT, 16 January 2023, lrt.lt.
[7] G. Trapikaitė, ‘Polish school ranked among the best in Lithuania – what's its secret?’, LRT, 10 September 2022, lrt.lt.
[8] M. Frėjutė-Rakauskienė, A. Marcinkevičius, D. Stumbrys, ‘Tautinė sudėtis ir jos kaita’ [in:] Lietuvos gyventojų demografinių struktūrų ir procesų kaita, LSMC Sociologijos institutas, 2023, Vilnius, p. 135.
[9] Changing educational profile of residents of Šalčininkai Municipality see Official Statistics Portal, osp.stat.gov.lt.
[10] Over the past four years, approximately 221,000 foreigners have arrived in Lithuania. The majority are economic migrants from the states of the former USSR, as well as political migrants from Belarus and asylum seekers from Ukraine.
[11] Change in the number of residents according to figures compiled by the Centre of Registers, see Registrų Centras, registrucentras.lt.
[12] Immigration to the region according to figures compiled by the Lithuanian statistical office, see Oficialiosios Statisticos portalas, osp.stat.gov.lt.
[13] See ‘W rejonie wileńskim rośnie liczba mieszkańców, ale unikają oni zameldowania’, ZW.LT, 14 February 2018, zw.lt.
[14] Development of suburban areas from 2011 to 2021 according to figures compiled by the Lithuanian National Statistical Office, source: storymaps.arcgis.com.
[15] ‘Duchniewicz nowym merem rejonu wileńskiego’, LRT, 20 March 2023, lrt.lt.
[16] The nationwide decline in birth rates is almost non-existent in the Vilnius metropolitan area. Statistics indicate that, for many decades, birth rates in the region have remained stable and have played an increasingly significant role in nationwide statistics.
[17] A. Pieszko, ‘Polska oświata w rejonie trockim kurczy się’, Kurier Wileński, 3 May 2024, kurierwilenski.lt.
[18] In 2021, the 20–24 age group comprised more than 8,000 individuals; therefore, in 2041 this will be the size of the 40–45 age group. For comparison, in 2021, the 40–45 age group included 13,000 individuals. In 2021, the youngest cohort (aged 0–4) comprised 6,700 individuals. It is expected that in the coming years, the youngest cohorts will be of a similar size.