Large volumes, limited significance

Contents
I. RULES OF TRADE BETWEEN THE EU AND UKRAINE
II. GENERAL OVERVIEW OF EU IMPORTS
III. KEY FOOD PRODUCTS IMPORTED FROM UKRAINE TO THE EU
IV. OTHER PRODUCTS WITH STRONG EXPORT POTENTIAL
V. PROSPECTS FOR UKRAINIAN FOOD EXPORTS TO THE EU
INTRODUCTION
The aim of this report is to examine the issue of food imports from Ukraine to the EU market between 2020 and 2024. This period witnessed a series of dramatic developments – Russia’s full-scale invasion of Ukraine, the temporary lifting of tariff quotas on Ukrainian foodstuffs by Brussels, and the introduction of embargoes on certain products by Ukraine’s neighbours. These events affected Ukraine’s trade with the EU in terms of both the distribution of specific categories of goods and their geographical structure.
The import of agri-food products from the Dnipro region has sparked major controversy in several member states, including Poland. It was one of the factors behind the farmers’ blockades at the border in late 2023 and early 2024. This issue is also set to become one of the greatest challenges in Ukraine’s European integration process, as well as in the reform of the Common Agricultural Policy. It is therefore worth considering the actual significance of Ukrainian food both for the EU as a whole and for the markets of individual member states.
This report outlines the reasons for, and the significance of, the EU market for Ukraine across various commodity categories. However, its main objective is to highlight the increasing presence of Ukrainian agri-food products in selected EU member states between 2020 and 2024. This paper examines developments over a five-year period: two years before and three years after the outbreak of the full-scale war.
The first chapter outlines the rules arising from the Deep and Comprehensive Free Trade Area (DCFTA) agreement, which has governed trade between Ukraine and the EU since 2016. The following section provides a general overview of food imports into the EU, identifying the groups of goods for which supplies from Ukraine are of particular significance. It also highlights the categories – which constitute the vast majority – in which Ukraine plays only a minor or virtually non-existent role on the EU market.
The main part of the report provides a detailed overview of individual agri-food products imported into the EU from Ukraine. These products fall into two categories: those for which Ukraine was already a significant supplier prior to the outbreak of the full-scale war (such as cereals), and those whose initially minimal imports began to grow rapidly after 2022 (such as sugar).
Information on each analysed product is presented in a consistent order:
- quota restrictions set out in the DCFTA (or the lack thereof),
- importance for the EU – whether the European Union as a whole depends on imports of the product (as in the case of soya beans), or whether it maintains an export surplus (as with wheat),
- the role of the EU market in Ukraine’s exports of the given product,
- import trends from Ukraine between 2020 and 2024,
- main non-EU suppliers (Ukraine’s competitors) to the EU market and changes in this regard between 2020 and 2024,
- key EU member states that import the given product from Ukraine.
In addition, for cereals, as well as rapeseed and soya beans, maps have been included showing the trade balance for each crop between individual member states and Ukraine. In the vast majority of cases, the analysis focuses on import volumes rather than values, as the former provide a more reliable measure owing to the significant price fluctuations of many agricultural products.
MAIN POINTS
- In 2024, Ukraine ranked third in terms of the value and first in terms of the volume of agri-food products supplied to the EU. Between 2020 and 2024, Ukrainian food exports to the EU rose from €5.8 billion to €13.1 billion, and from 18 million to 34.1 million tonnes. Nevertheless, the overall importance of Ukraine’s agri-food sector to the EU remains relatively limited. In 2024, it accounted for 6.7% of the value and 21.7% of the volume of the EU’s food imports from non-member states. Ukraine held a significant position among non-EU countries in only three agri-food categories: cereals, oilseeds, and vegetable oils. In 2024, the EU sourced 46% of its imports in these groups from Ukraine. In other categories, Ukraine’s role was marginal or non-existent, although in some cases – such as sugar and eggs – there were notable increases over the five-year period. For Kyiv, however, the EU was an important food export market even before the war, accounting for around 28% of Ukraine’s agri-food exports. After the introduction of the Autonomous Trade Measures (ATM), the EU’s share increased – by 2024, 52% of Ukraine’s agri-food production was directed to EU markets.
- The DCFTA, in force since 2016, fully liberalises trade in most goods. However, for key food products such as cereals, meat, and dairy, it sets tariff quotas. Once these quotas are exceeded, customs duties are applied – typically at levels that render further imports economically unviable. In June 2022, the European Commission (EC) introduced the Autonomous Trade Measures (ATM) to support Ukraine following the invasion. These measures suspended all such restrictions. Combined with Russia’s blockade of Black Sea ports at the time, this led to a temporary surge of Ukrainian agricultural produce into the markets of neighbouring EU member states. As a result, several of these countries imposed unilateral embargoes or licensing systems on numerous food categories. In June 2025, the EC decided not to extend the ATM, marking a return to the rules set out under the DCFTA.
- The outbreak of full-scale war caused temporary disruptions to maritime routes, which had been the main channel for exporting Ukrainian agricultural produce. However, following the launch of a new Black Sea corridor in September 2023, EU imports of Ukrainian grain were once again conducted almost exclusively by sea. The primary recipients were southern European countries and the Benelux states, which possess well-developed food processing industries and livestock sectors. In 2024, Spain, the Netherlands, and Italy accounted for nearly 80% of the grain imported by the EU from Ukraine. Spain stands out as a particular case, as it leads the EU in pork production. In 2024, it was the principal destination for Ukrainian wheat, maize, and barley, as well as for feed components derived from rapeseed extraction.
- In the oilseed category, Ukraine supplies the EU primarily with rapeseed and significant quantities of soya beans. In 2023, Poland and other EU neighbours of Ukraine imposed embargoes or licensing systems on these products, resulting in a suspension of imports in the following year. The main importers are Germany, Belgium, and the Netherlands.
- Ukraine has significantly expanded its oilseed processing sector and is a key supplier to the EU market of rapeseed, sunflower, and soya oil. It is also an important supplier of by-products from the pressing of these seeds, which form a crucial component of livestock feed.
- As for meat, Ukraine exports only poultry to the EU. Although imports of Ukrainian poultry more than doubled following Russia’s invasion, this category was once again subject to restrictions under the ATM in 2024. The main recipient was the Netherlands, which accounted for more than half of Ukraine’s poultry exports to the EU market.
- The implementation of the ATM in 2022 led to a sharp increase in imports of certain agri-food products that EU member states had either not sourced from Ukraine prior to the war or had imported only in small quantities. While volumes in most cases remain relatively modest, the upward trend has become noticeable. These products are often first directed to neighbouring countries, raising concerns among local producers. This is not a uniform category of goods – they are typically high value-added products such as sugar, powdered milk, or fruit juices, rather than unprocessed raw materials such as raspberries or hen eggs.
- If Russia does not reimpose a blockade on Black Sea ports, the trend observed since late 2023 is likely to continue, with Ukraine shipping most of its grain by sea, primarily to southern European countries and, to some extent, the Benelux states. Even if neighbouring states lift their import restrictions, a significant increase in overland deliveries is unlikely, as Ukraine’s export logistics are now largely geared towards seaborne transport.
- The cancellation of the ATM in 2025 will reduce sales of certain goods to the EU – particularly wheat, sugar, poultry, and processed grain products. However, the first months following this change confirmed Ukraine’s ability to redirect part of its exports to the Middle East. Given the low duty-free quotas, Ukrainian exports of higher value-added goods to the EU are set to remain limited.
- The Ukrainian agri-food processing sector appears unlikely to develop due to the war, an uncertain investment climate and efforts to undermine anti-corruption measures. However, this may occur in the longer term, particularly if the country achieves full integration with the EU market.
I. RULES OF TRADE BETWEEN THE EU AND UKRAINE
Trade between the EU and Ukraine is governed by the Deep and Comprehensive Free Trade Area (DCFTA), which forms part of the Association Agreement. It began to apply provisionally on 1 January 2016 and entered fully into force on 1 September 2017. An annex to the agreement set out tariff rates for nearly 10,000 goods. For almost 90% of these, tariffs on imports from Ukraine were entirely eliminated. For most of the remainder, a gradual phase-out of tariffs over a period of up to 10 years was envisaged. However, the DCFTA did not provide for full trade liberalisation. Tariff quotas were set for 361 products across 36 categories. Once these quotas were exceeded, customs duties were applied – often at prohibitively high levels.
Table. Tariff quotas provided for in the DCFTA
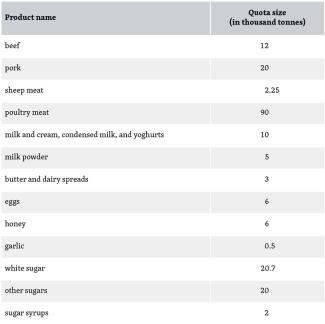
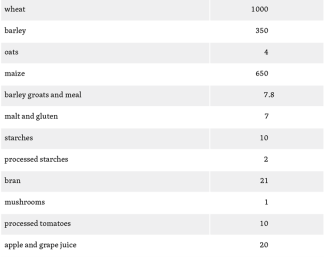
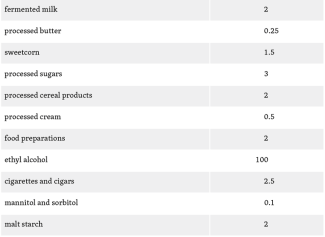
All products subject to quotas fall within the agri-food sector, reflecting an intention to protect this branch of the economy in EU member states. This applies both to goods that form the backbone of Ukraine’s export portfolio (such as cereals) and to those that the country scarcely exports (such as sheep meat).
The full-scale war and Russia’s blockade of Black Sea ports – the main route for Ukrainian agricultural exports – prompted the European Commission (EC) in June 2022 to remove all tariffs and quotas through the introduction of the Autonomous Trade Measures (ATM), aimed at supporting Ukraine’s exports. As a result, there was a sharp increase in food shipments to Ukraine’s immediate neighbours and to Bulgaria. In response, these countries imposed unilateral import restrictions on wheat, maize, rapeseed, and sunflower seeds.[1] In May 2023, the EC introduced temporary restrictions on the import of these four products into the affected countries. However, on 15 September of that year, it decided not to extend the measures. The neighbouring states disregarded this decision and maintained their bans on selected Ukrainian agricultural goods or – in the cases of Romania and Bulgaria – introduced licensing systems that effectively closed their markets. Poland added wheat flour, wheat and maize milling products, and rapeseed cake to the restricted list, while Hungary expanded its embargo to cover 25 agri-food products.
The launch of the Black Sea corridor in September 2023, which enabled the resumption of maritime exports via the ports of Odesa, Chornomorsk, and Pivdennyi, reduced the importance of agricultural sales to neighbouring countries.[2] In 2024, 95% of wheat, 96% of barley and 92% of maize exported abroad was shipped through these ports. In the first half of 2025, their share increased further to 98%, 96%, and 97% respectively.
The ATM were initially introduced in 2022 for one year, but the European Commission extended them twice. In June 2024, their functioning was modified through the introduction of a ‘safeguard clause’ covering poultry, eggs, sugar, oats, maize, groats, and honey. If imports of any of these products exceeded the average level recorded in the second half of 2021 and in 2022 and 2023, tariffs would be reinstated. This mechanism was triggered for groats, eggs, sugar, and oats. In June 2025, the ATM were not renewed. At the end of that month, the Commission proposed amendments to the DCFTA that would increase certain tariff quotas (see below), but the proposal has yet to be approved.
II. GENERAL OVERVIEW OF EU IMPORTS
Agri-food production is Ukraine’s most important export sector, and its role has grown since the outbreak of the full-scale war. In 2021, it accounted for 41% of the country’s total export value, rising to 59% in 2024. The EU market was already significant for Ukrainian food producers before the invasion, absorbing nearly 28% of these exports. Following the introduction of the ATM, the importance of the EU increased further – by 2024, 52% of Ukraine’s agri-food products were destined for EU markets.
Between 2020 and 2024, the value of Ukrainian food exports to the EU rose from €5.8 billion to €13.1 billion, representing 6.7% of the EU’s food imports from non-member countries. In terms of volume, exports grew from 18 million to 34.1 million tonnes, accounting for 21.7% of the EU’s agri-food imports from outside the bloc. In 2024, Ukraine ranked third among food suppliers to the EU by value, behind Brazil and the United Kingdom, and first in terms of volume. The main products exported to the EU were cereals, oilseeds, vegetable oils, and feed components (oilseed cake). In 2024, Ukraine accounted for 36% of the volume and 29% of the value of EU imports in these categories. Compared with the last year before the war, all these segments recorded increases in both volume and value.
Chart 1. Key agricultural exports from Ukraine to the EU in 2020 and 2024
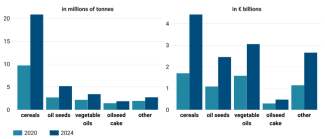
Source: Eurostat.
Despite this favourable growth trend, most categories of Ukrainian food products play only a minor role on the EU market. Only three groups carry significant weight: cereals (which accounted for 46.5% of imports from non-EU countries), industrial crops, including oilseeds (16.7%), and vegetable oils (19.7%). All other categories are currently of little importance, although some products have recorded notable increases in recent years.
Chart 2. Ukraine’s share in EU agri-food imports in 2024
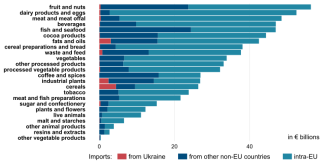
Source: Eurostat.
III. KEY FOOD PRODUCTS IMPORTED FROM UKRAINE TO THE EU
This section of the report analyses EU imports of the most important agri-food products sourced from Ukraine: cereals, oilseeds, and vegetable oils, as well as feed components, poultry meat, and honey. In 2024, these goods accounted for 84% of the value of agri-food products purchased by the EU from Ukraine.
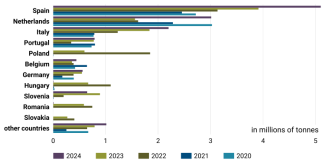
Cereals – specifically three types: wheat, maize, and barley – are the most important agricultural products supplied from Ukraine to the EU market, both in terms of value and volume. Between 2020 and 2024, imports of these cereals from Ukraine more than doubled, increasing from 9.7 million to 20.9 million tonnes.
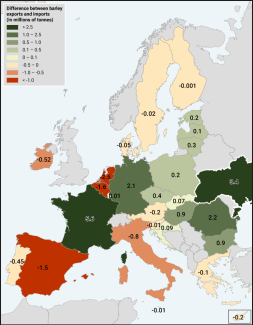
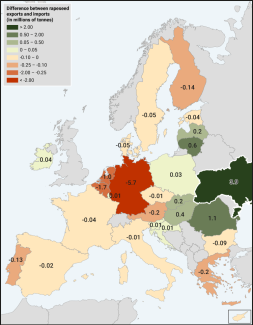
The EU as a whole is a net exporter of wheat, but individual member states differ significantly in this regard. Southern European countries and the Benelux import more wheat than they export, while France is the leading exporter. Notably, all EU neighbours of Ukraine have substantial wheat surpluses, indicating that they have little interest in competing imports from Ukraine. This helps to explain the import restrictions introduced in 2023. At the same time, Ukraine has a larger wheat export surplus than any EU member state.
Map 1. Difference between wheat exports and imports in EU member states and Ukraine in 2024
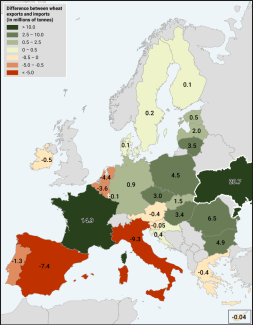
Source: Eurostat, State Customs Service of Ukraine.
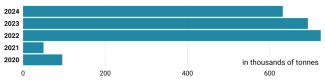
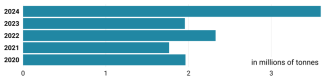
Under the DCFTA, the tariff quota for wheat was set at 1 million tonnes per year. Once this threshold was exceeded, the remaining volume was subject to a duty of €95 per tonne. The European Commission has proposed raising the quota to 1.3 million tonnes. Before Russia’s full-scale invasion, Ukraine exported wheat to the EU but did not utilise the full duty-free quota. This changed dramatically in 2022, when the loss of access to maritime routes pushed wheat exports to the EU to 3 million tonnes. By 2024, this figure had reached 6.4 million tonnes, with the EU market absorbing 36% of Ukraine’s total wheat exports.
Chart 3. Wheat imports from Ukraine to the EU, 2020–2024
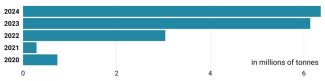
Source: Eurostat.
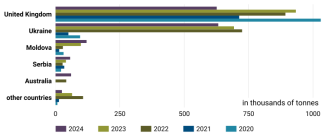
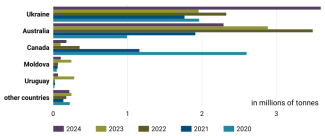
Over the past three years, Ukraine has become the leading supplier of wheat to the EU market among non-member states. In 2024, it accounted for 59% of wheat imported from outside the EU. Ukraine’s main competitors that year were Canada and the United States, with the United Kingdom and Russia playing a more limited role.
Chart 4. Leading wheat suppliers to the EU market, 2020–2024
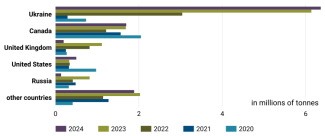
Source: Eurostat.
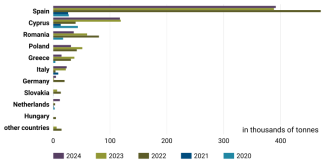
The geography of Ukrainian wheat sales to the EU has shifted significantly over the past five years. Following the outbreak of the war, the grain initially flowed to neighbouring countries. However, after those states introduced import restrictions and a stable maritime corridor was opened in the fourth quarter of 2023, the flow was redirected towards Southern Europe. While the EU as a whole is a major producer and exporter of wheat, some member states with well-developed livestock sectors – such as Italy, Spain, and the Netherlands – are unable to meet their own domestic demand. Spain, in particular, stands out: in 2024, it imported 4.8 million tonnes of Ukrainian wheat, accounting for 75% of Ukraine’s total wheat exports to the EU.
Chart 5. Leading EU importers of Ukrainian wheat, 2020–2024
Source: Eurostat.
The situation is markedly different in the case of maize. All of the ‘old EU’ member states, with the exception of France, are net importers of this grain. By contrast, countries bordering Ukraine are among the EU’s net exporters of maize. As the world’s fourth-largest maize exporter (accounting for 11% of global exports in 2024), Ukraine has a surplus many times greater than that of any individual EU member state.
Map 2. Difference between maize exports and imports in EU member states and Ukraine in 2024
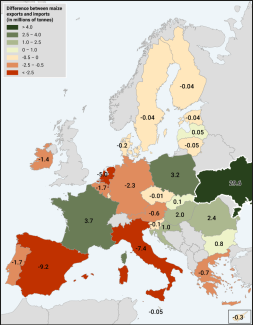
Source: Eurostat, State Customs Service of Ukraine.
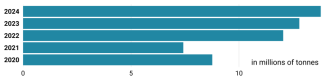
Although the DCFTA envisages a tariff quota for maize set at 650,000 tonnes (with the European Commission’s new proposal raising this to 1 million tonnes), in practice the EU does not impose duties on maize imports from third countries. As a result, even before the war, Ukrainian exports significantly exceeded this quota, reaching 7.4 million tonnes in 2021. Following the outbreak of the full-scale war, exports rose sharply, reaching 13.8 million tonnes in 2024 – accounting for 48% of Ukraine’s total maize exports.
Chart 6. Maize Imports from Ukraine to the EU, 2020–2024
Source: Eurostat.
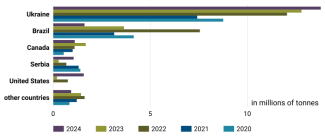
Between 2020 and 2024, Ukraine maintained a clear lead as the principal supplier of maize to the EU market. Its position strengthened steadily over this period, primarily at the expense of Brazil. In 2024, exporters from Ukraine accounted for 69% of the EU’s maize imports from non-member countries.
Chart 7. Leading maize suppliers to the EU market, 2020–2024
Source: Eurostat.
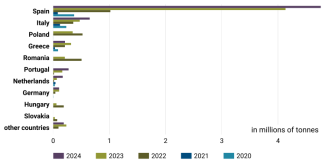
As with wheat, Russia’s full-scale invasion led to a temporary increase in maize exports to neighbouring countries. This trend came to a halt following the imposition of import bans in 2023. In 2024, the principal buyers of Ukrainian maize were Spain, the Netherlands, and Italy.
Chart 8. Leading EU importers of Ukrainian maize, 2020–2024
Source: Eurostat.
The EU is a net exporter of barley, but – as with wheat – Southern European countries and the Benelux import more than they export. Among Ukraine’s neighbours, only Romania exports significant quantities of this grain. Compared with EU member states, Ukraine is a notable, though not the largest, exporter of barley.
Map 3. Difference between barley exports and imports in EU member states and Ukraine in 2024
Source: Eurostat, State Customs Service of Ukraine.
The Deep and Comprehensive Free Trade Area agreement sets a tariff quota for barley at 350,000 tonnes. Once this threshold is exceeded, a duty of €93 per tonne is applied. The European Commission has proposed raising the quota to 450,000 tonnes. Before the war, imports from Ukraine did not exceed 100,000 tonnes. After the invasion, volumes surged to more than 600,000 tonnes. In 2024, 20% of Ukraine’s barley exports were directed to the EU market.
Chart 9. Barley imports from Ukraine to the EU, 2020–2024
Source: Eurostat.
Over the past three years, Ukraine has become a leading supplier of barley to the EU market, alongside the United Kingdom. In 2024, it accounted for 42% of the EU’s barley imports from non-member countries.
Chart 10. Leading barley suppliers to the EU market, 2020–2024
Source: Eurostat.
As with wheat and maize, Spain was the main buyer of Ukrainian barley. In 2024, it accounted for 62% of Ukraine’s barley exports to the EU.
Chart 11. Leading EU importers of Ukrainian barley, 2020–2024
Source: Eurostat.
Unlike grain imports, the purchase of oilseed crops is not covered by the provisions of the DCFTA. The EU is a net importer of rapeseed, soya beans, and sunflower seeds.
Among EU member states, Romania is the only significant exporter of rapeseed, while Germany is the largest importer. Ukraine has a greater export potential for rapeseed than any individual EU country.
Map 4. Difference between rapeseed exports and imports in EU member states and Ukraine in 2024
Source: Eurostat, State Customs Service of Ukraine.
The war had no significant impact on Ukraine’s rapeseed exports to the EU between 2020 and 2023, with volumes remaining stable at around 2 million tonnes. In 2024, however, exports rose sharply to 3.6 million tonnes, driven by increased sales to Germany, Belgium, and the Netherlands. That year, 90% of Ukraine’s rapeseed exports were directed to the EU market.
Chart 12. Rapeseed imports from Ukraine to the EU, 2020–2024
Source: Eurostat.
In 2024, Ukraine became the leading supplier of rapeseed to the EU, accounting for 56% of the EU’s imports of this product. It displaced Canada and, to a lesser extent, Australia from the market.
Chart 13. Leading rapeseed suppliers to the EU market, 2020–2024
Source: Eurostat.
In 2024, the main recipients of Ukrainian rapeseed were Germany, Belgium, the Netherlands, and France, which together accounted for 92% of Ukraine’s exports. Poland and Ukraine’s other EU neighbours imposed embargoes or licensing systems in 2023, resulting in a halt in imports to those countries in the following year. In 2025, representatives of Poland’s oilseed processing industry began calling for the ban to be lifted owing to a shortage of raw materials.[3]
Chart 14. Key EU importers of Ukrainian rapeseed, 2020–2024
Source: Eurostat.
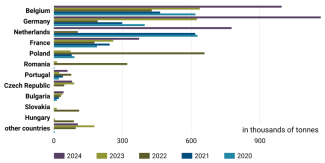
Almost all EU member states – particularly Spain, Germany, the Netherlands, and Italy – are net importers of soya beans. Compared with EU member states, Ukraine has considerable export potential in this area.
Map 5. Difference between soya bean exports and imports in EU member states and Ukraine in 2024
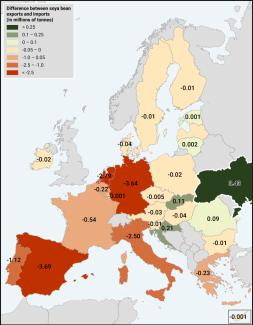
Source: Eurostat, State Customs Service of Ukraine.
Over the past five years, Ukraine’s soya bean exports have nearly tripled – rising from 484,000 tonnes in 2020 to 1.3 million tonnes in 2024. The EU is a key market for Kyiv, with 41% of its soya exports directed to the bloc in 2024.
Chart 15. Soya bean imports from Ukraine to the EU, 2020–2024
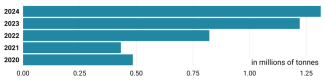
Source: Eurostat.
Unlike cereals or rapeseed, Ukraine is not a major supplier of soya beans to the EU market. In 2024, it accounted for 9% of the EU’s soya imports from non-member countries, with Brazil and the United States dominating this segment.
Chart 16. Leading soya bean suppliers to the EU market, 2020–2024
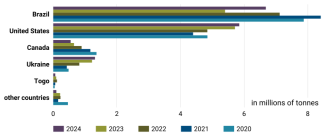
Source: Eurostat.
Ukrainian soya bean exports are relatively well diversified geographically, with the Netherlands and Germany being the key recipients. After the outbreak of the war, significant volumes also began to flow to neighbouring countries, including Poland. However, unlike grain or rapeseed imports, soya deliveries have not provoked significant controversy.
Chart 17. Leading EU importers of Ukrainian soya beans, 2020–2024
Source: Eurostat.
Sunflower seeds represent something of an exception. Although Ukraine ranks as the world’s second-largest producer – after Russia – accounting for nearly 25% of global output in the 2024/2025 season, it exports only small quantities. This is due to an export duty introduced in 1999, which encourages domestic processing. The full-scale invasion led to a temporary increase in exports – reaching 1.9 million tonnes in 2022 – but volumes declined in subsequent years and, by 2024, had returned to pre-war levels. In 2024, the EU accounted for 85% of Ukraine’s sunflower seed exports.
Chart 18. Sunflower seed imports from Ukraine to the EU, 2020–2024
Source: Eurostat.
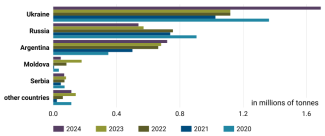
In 2024, just over 17% of the sunflower seeds imported into the EU originated from Ukraine. Earlier, in 2022–2023, Ukraine had temporarily become the EU’s leading supplier of sunflower seeds; however, in 2024 it lost this position to Moldova.
Chart 19. Leading sunflower seed suppliers to the EU market, 2020–2024
Source: Eurostat.
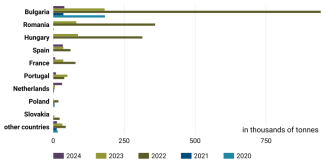
In 2022–2023, the main destinations for Ukrainian sunflower seeds were Bulgaria, Romania, and Hungary. A year later, Spain, Bulgaria, and the Netherlands topped the list, although the volumes involved remained relatively small.
Chart 20. Leading EU importers of Ukrainian sunflower seeds, 2020–2024
Source: Eurostat.
Ukraine exports not only oilseeds but also their processed products – primarily vegetable oils. It ranks among the world’s leading exporters in this category. According to FAO data, in 2023 Ukraine was the world’s largest exporter of sunflower oil and ranked eighth in exports of rapeseed and soya oils. The DCFTA does not impose any tariffs or tariff quotas on this category of goods.
The European Union is a net exporter of rapeseed oil. Over the past five years, Ukraine has nearly quadrupled its rapeseed oil exports to the EU, rising from 53,000 tonnes in 2020 to 197,000 tonnes in 2024. The EU is the key market for this product, receiving 75% of Ukraine’s rapeseed oil exports in 2024.
Chart 21. Rapeseed oil imports from Ukraine to the EU, 2020–2024
Source: Eurostat.
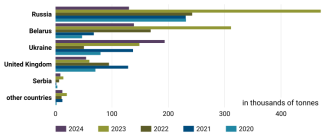
Between 2020 and 2024, Ukraine emerged as the leading exporter of rapeseed oil to the EU. In 2024, it accounted for more than 50% of the EU’s imports of this product. Other notable suppliers were Belarus, the United Kingdom, and Russia, although their importance has declined in recent years.
Chart 22. Leading rapeseed oil suppliers to the EU market, 2020–2024
Source: Eurostat.
Poland is the largest buyer of Ukrainian rapeseed oil – in 2024, it accounted for 36% of Ukraine’s exports of this product to the EU. However, compared with Poland’s own production, estimated at 1.5 million tonnes, this represents only a marginal volume. In 2024, Kyiv significantly strengthened its position in several other member states, particularly Belgium, Spain, and Italy.
Chart 23. Leading EU importers of Ukrainian rapeseed oil, 2020–2024
Source: Eurostat.
The European Union is a net exporter of soya oil. Between 2020 and 2024, imports of this product from Ukraine nearly doubled, increasing from 177,000 tonnes in 2020 to 324,000 tonnes in 2024. The EU market is critically important for Kyiv – in 2024, it absorbed 86% of Ukraine’s soya oil exports.
Chart 24. Soya oil imports from Ukraine to the EU, 2020–2024
Source: Eurostat.
Over the past five years, Ukraine has consolidated its position as the leading supplier of soya oil to the EU market. In 2024, it accounted for almost 50% of the EU’s soya oil imports from third countries. Other notable sources included Argentina, Norway, Serbia, and the United Kingdom.
Chart 25. Leading soya oil suppliers to the EU market, 2020–2024
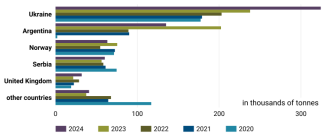
Source: Eurostat.
Ukrainian soya oil is sent almost exclusively to Poland. In 2024, Poland accounted for 87% of Ukraine’s soya oil exports to the EU. It is worth noting that domestic production of this product in Poland remains negligible.
Chart 26. Leading EU importers of Ukrainian soya oil, 2020–2024
Source: Eurostat.
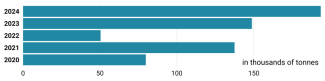
The EU is a net importer of sunflower oil. Between 2020 and 2023, its member states imported just under 2 million tonnes of sunflower oil from Ukraine each year. However, in 2024, export volumes increased significantly to nearly 2.9 million tonnes. It is currently difficult to determine whether this represents a one-off occurrence or the beginning of a broader trend. The EU market plays an important role in the sale of Ukrainian sunflower oil – in 2024, it absorbed 56% of the country’s exports of this product.
Chart 27. Sunflower oil imports from Ukraine to the EU, 2020–2024
Source: Eurostat.
Ukraine holds a dominant position in the supply of sunflower oil to the EU. In 2024, it accounted for 94% of the EU’s imports of this product.
Chart 28. Leading sunflower oil suppliers to the EU market, 2020–2024
Source: Eurostat.
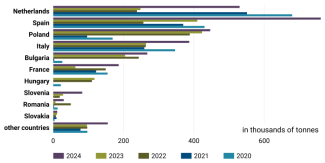
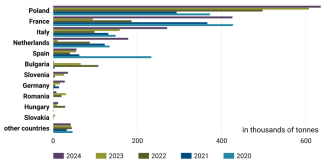
In 2024, Spain became the largest EU importer of Ukrainian sunflower oil, accounting for 27% of Ukraine’s exports of this product. The next largest importers were the Netherlands, Poland, Italy, Bulgaria, and France.
Chart 29. Leading EU importers of Ukrainian sunflower oil, 2020–2024
Source: Eurostat.
The presence of a highly developed vegetable oil industry in Ukraine means the country generates significant volumes of by-products from oil pressing. These by-products, known as oilseed cakes, are rich in protein and fibre. Due to their high nutritional value, they are widely used as feed for livestock – including cattle, pigs, and poultry. Ukraine is a major exporter of oilseed cakes, much as it is for vegetable oils. In 2023, it ranked first globally in sunflower cake exports, ninth in rapeseed cake, and thirteenth in soya cake. The DCFTA does not impose any tariffs or tariff quotas on these products.
Rapeseed cake is the only type of oilseed cake for which the EU is a net exporter. In 2022, imports from Ukraine temporarily collapsed, but by the following year they had recovered to nearly 150,000 tonnes and, in 2024, rose to almost 200,000 tonnes. That year, 79% of Ukraine’s exports of this agricultural product were directed to the EU.
Chart 30. Rapeseed cake imports from Ukraine to the EU, 2020–2024
Source: Eurostat.
In 2024, Ukraine became the largest supplier of rapeseed cake to the EU market, surpassing Belarus and Russia. Aside from these three countries, the United Kingdom also plays a modest role in EU imports of this product.
Chart 31. Leading rapeseed cake suppliers to the EU market, 2020–2024
Source: Eurostat.
Until 2023, Poland was the principal buyer of Ukrainian rapeseed cake. However, in September of that year, Warsaw imposed an import ban on this product. This move was somewhat surprising, as the ban did not extend to rapeseed cake from Belarus, which Poland continued to import in 2024. Ukraine managed to offset the loss of the Polish market by increasing sales to Spain and Hungary.
Chart 32. Leading EU importers of Ukrainian rapeseed cake, 2020–2024
Source: Eurostat.
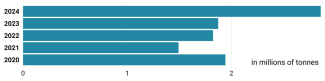
The European Union is a net importer of soya cake. Over the past five years, it has steadily increased its purchases from Ukraine, rising from 186,000 tonnes in 2020 to 607,000 tonnes in 2024. The EU is the key export market for this product, receiving 88% of Ukraine’s soya cake exports in 2024.
Chart 33. Soya cake imports from Ukraine to the EU, 2020–2024
Source: Eurostat.
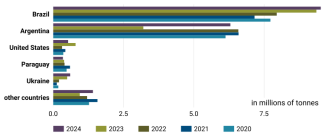
Despite the significant increase in export volumes, Ukraine is not a major supplier of soya cake to the EU. In 2024, it accounted for only 3% of the EU’s soya cake imports from non-member countries. The vast majority is sourced from South America, with Brazil and Argentina together providing 85% of the EU’s soya cake supply.
Chart 34. Leading soya cake suppliers to the EU market, 2020–2024
Source: Eurostat.
In 2024, Ukrainian soya cake was exported primarily to Poland, which received more than half of Ukraine’s total exports of this product. Other notable importers included Romania and Hungary, while the remaining EU countries imported only minimal quantities.
Chart 35. Leading EU importers of Ukrainian soya cake, 2020–2024
Source: Eurostat.
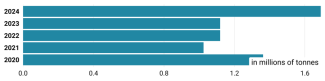
The EU is a net importer of sunflower cake. The war did not significantly affect the volume of imports from Ukraine; however, in 2024 these volumes reached a record high of nearly 1.7 million tonnes. That year, the EU market absorbed 43% of Ukraine’s sunflower cake exports.
Chart 36. Sunflower cake imports from Ukraine to the EU, 2020–2024
Source: Eurostat.
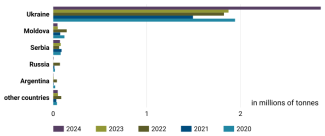
Between 2020 and 2024, Ukraine was the leading supplier of sunflower cake to the EU market. In 2024, it accounted for 53% of the EU’s imports of this product from non-member countries. Its main competitors in this segment were Russia and Argentina.
Chart 37. Leading sunflower cake suppliers to the EU market, 2020–2024
Source: Eurostat.
The primary recipient of Ukrainian sunflower cake was Poland, although significant volumes were also delivered to France, Italy, and the Netherlands.
Chart 38. Leading EU importers of Ukrainian sunflower cake, 2020–2024
Source: Eurostat.
The Deep and Comprehensive Free Trade Area agreement provides specific protection for the EU meat market. Tariff quotas were introduced for imports of beef, pork, and lamb – products that Ukraine did not export to the EU or to most other countries (for example, in 2024 it exported only 3,000 tonnes of pork in total). Poultry, however, is a different case. Prior to the implementation of the ATM, exports were capped at 90,000 tonnes – a limit that the European Commission now proposes to raise to 120,000 tonnes.
Following the outbreak of the war, Ukrainian poultry exports to the EU increased – peaking at 173,000 tonnes in 2023 – before declining to 133,000 tonnes in 2024. That year, the EU absorbed 31% of Ukraine’s poultry meat exports. The sector is dominated by a single company: MHP, Ukraine’s largest agroholding, owned by Yuriy Kosiuk, which accounted for over 90% of the country’s poultry exports in 2023.
Chart 39. Poultry meat imports from Ukraine to the EU, 2020–2024
Source: Eurostat.
Ukraine is the second-largest supplier of poultry meat to the EU, after the United Kingdom. Aside from these two countries, Brazil is the only other significant player in this segment.
Chart 40. Leading poultry meat suppliers to the EU market, 2020–2024
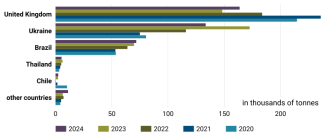
Source: Eurostat.
Ukrainian poultry meat is transported primarily to the Netherlands, which in 2024 accounted for 57% of Ukraine’s exports of this product to the EU. The Slovak and Austrian markets are also significant for Kyiv. In 2023, Poland and Hungary imposed bans on imports of poultry meat from Ukraine.
Chart 41. Leading EU importers of Ukrainian poultry meat, 2020–2024
Source: Eurostat.
The European Union is a net importer of honey. The DCFTA set an annual tariff quota of 6,000 tonnes (the European Commission has proposed increasing this to 35,000 tonnes). Once this limit is exceeded, a duty of 17.3% is applied. Over the past five years, Ukraine has regularly filled this quota, but the duty has not rendered its honey uncompetitive. The war has not significantly affected Ukraine’s honey exports to the EU. The EU market remains critical for Ukrainian producers – in 2024, it absorbed 83% of the country’s honey exports.
Chart 42. Honey imports from Ukraine to the EU, 2020–2024
Source: Eurostat.
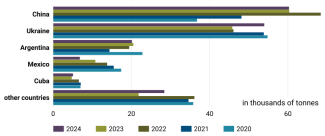
Until 2022, Ukraine was the largest supplier of honey to the EU among non-member countries. However, in 2022 it was overtaken by China, which has held the leading position since then. Other major exporters to the EU include Argentina, Mexico, and Cuba.
Chart 43. Leading honey suppliers to the EU market, 2020–2024
Source: Eurostat.
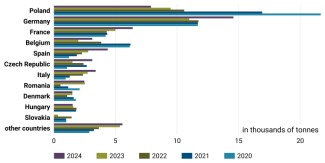
Until 2021, Poland was the largest importer of Ukrainian honey. However, following Russia’s invasion, imports began to decline, and Germany took over as the leading destination. Overall, exports of this product are relatively well diversified, making it difficult to identify a clearly defined group of main recipient countries.
Chart 44. Leading EU importers of Ukrainian honey, 2020–2024
Source: Eurostat.
- OTHER PRODUCTS WITH STRONG EXPORT POTENTIAL
The implementation of the ATM led to a sharp increase in imports of certain agri-food products that the EU had either not sourced from Ukraine prior to the war or had imported only in small quantities. In most cases, volumes remain modest, but Ukraine’s presence in these segments has become increasingly noticeable. These products are often primarily imported by neighbouring countries, which has led to tensions with domestic producers. The goods in question do not form a uniform group, but they generally belong to the category of high value-added products rather than unprocessed raw materials.
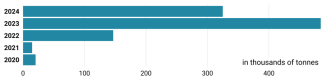
Over the past five years – with the exception of 2023 – the EU has been a net exporter of white sugar. The DCFTA imposed a tariff quota of 20,700 tonnes per year, which the European Commission has proposed increasing to 100,000 tonnes. Once this threshold was reached, imports were subject to a duty of €41.90 per 100 kg. Prior to Russia’s full-scale invasion, Ukraine did not make use of the allocated quota. However, following the introduction of the ATM, exports to the EU rose rapidly, reaching nearly 0.5 million tonnes in 2023. The following year, a ‘safeguard clause’ was triggered, reducing import volumes, although they still exceeded 300,000 tonnes. The EU market is relatively important for Ukraine – in 2024, member states purchased 40% of its sugar exports.
Chart 45. Sugar imports from Ukraine to the EU, 2020–2024
Source: Eurostat.
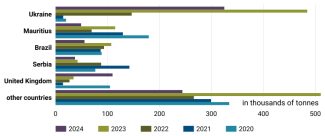
Ukraine is the most important supplier of white sugar to the EU. In 2024, it accounted for almost 40% of the bloc’s sugar imports from non-member countries. The EU also imported sugar from Mauritius, Brazil, Serbia, and the United Kingdom.
Chart 46. Leading sugar suppliers to the EU market, 2020–2024
Source: Eurostat.
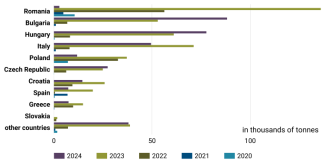
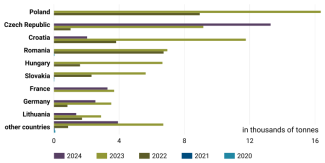
After February 2022, Ukraine’s neighbours (with the exception of Slovakia), as well as Bulgaria, began purchasing increasing amounts of sugar from the country. In 2024, other notable importers included Italy, the Czech Republic, and Croatia. Romania, which was the largest importer in 2023 (136,000 tonnes), introduced an import licensing system on 1 January 2024, which effectively halted supplies of Ukrainian sugar to the country.
Chart 47. Leading EU importers of Ukrainian sugar, 2020–2024
Source: Eurostat.
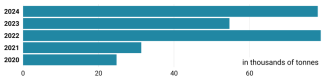
The DCFTA established a combined tariff quota for apple and grape juice (the latter of which Ukraine exports only negligible amounts) at 20,000 tonnes per year. The European Commission has proposed increasing it to 30,000 tonnes. Once the quota is exceeded, import duties of 18–30% apply, depending on the type of juice. Before the Russian invasion, Kyiv usually exceeded the quota slightly. Afterwards, exports more than doubled, reaching 78,000 tonnes. The EU market is highly important for Ukraine – in 2024, it absorbed 75% of the country’s apple juice exports.
Chart 48. Apple juice imports from Ukraine to the EU, 2020–2024
Source: Eurostat.
In 2024, Ukraine was the leading supplier of apple juice to EU member states, accounting for 35% of imports from non-member states. Other notable suppliers included Turkey, Moldova, and China.
Chart 49. Leading apple juice suppliers to the EU market, 2020–2024
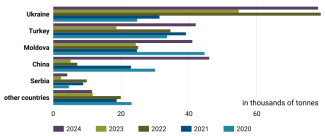
Source: Eurostat.
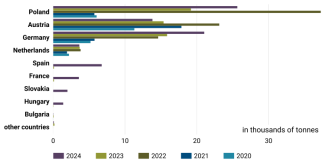
The largest recipients of Ukrainian apple juice were Poland (33% in 2024), Austria, and Germany. Notably, in 2024, Ukraine also succeeded in entering the markets of Spain, France, Slovakia, and Hungary.
Chart 50. Leading EU importers of Ukrainian apple juice, 2020–2024
Source: Eurostat.
The Deep and Comprehensive Free Trade Area removed tariffs on raspberries and does not impose any restrictions on their import. Between 2020 and 2024, imports of these fruits by the EU more than tripled – rising from 17,700 to 55,700 tonnes. In 2024, EU member states purchased 98% of Ukraine’s raspberry exports.
Chart 51. Frozen raspberry imports from Ukraine to the EU, 2020–2024
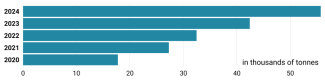
Source: Eurostat.
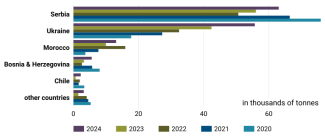
In 2024, Ukraine was the second-largest supplier of frozen raspberries to the EU market, behind Serbia, and has been steadily closing the gap over the past five years. Other notable suppliers to the EU include Morocco and Bosnia and Herzegovina.
Chart 52. Leading frozen raspberry suppliers to the EU market, 2020–2024
Source: Eurostat.
Over the past five years, Poland has been the largest importer of raspberries from Ukraine. In 2024, it accounted for 34% of Ukraine’s raspberry exports. In recent years, Ukraine has also strengthened its position in Germany and the Czech Republic.
Chart 53. Leading EU importers of Ukrainian frozen raspberries, 2020–2024
Source: Eurostat.
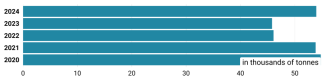
The European Union is a net exporter of hen eggs. The DCFTA set a tariff quota for eggs at 6,000 tonnes per year (the European Commission has proposed increasing this to 18,000 tonnes). Once the quota is exceeded, a duty of €30.40 per 100 kg is applied. Until February 2022, Ukraine did not utilise this quota. However, following the outbreak of the full-scale war, its egg exports rose rapidly – from 2,300 tonnes in 2021 to 54,000 tonnes three years later. This product was covered by the ‘safeguard clause’ introduced under the updated ATM in 2024. The EU market is highly important for Ukraine – in 2024, it absorbed 70% of the country’s egg exports.
Chart 54. Hen egg imports from Ukraine to the EU, 2020–2024
Source: Eurostat.
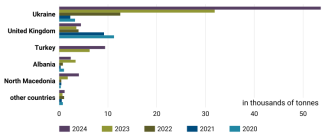
In 2022, Ukraine became the leading supplier of hen eggs to the EU, overtaking the United Kingdom. EU member states also import relatively small quantities from Turkey, Albania, and North Macedonia.
Chart 55. Leading hen egg suppliers to the EU Market, 2020–2024
Source: Eurostat.
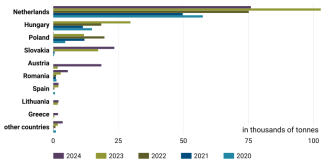
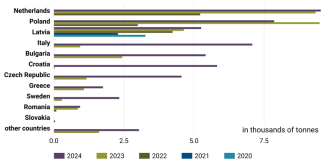
Before the full-scale invasion, Latvia was the only EU country importing eggs from Ukraine. Since 2022, the situation has changed dramatically – Ukraine has successfully entered numerous new markets, most notably the Netherlands, Poland, Italy, Bulgaria, Croatia, and the Czech Republic.
Chart 56. Leading EU importers of Ukrainian hen eggs, 2020–2024
Source: Eurostat.
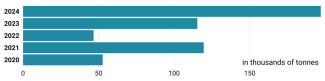
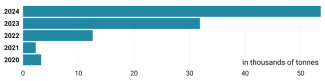
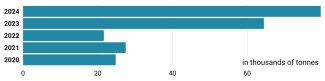
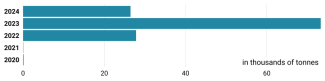
The European Union is a net importer of ethyl alcohol. The DCFTA sets a tariff quota for this product at 100,000 tonnes per year (the European Commission has proposed increasing this to 125,000 tonnes). Once this limit is exceeded, imports are subject to a duty of €19.20 per hectolitre. Despite a significant increase in imports from Ukraine – reaching nearly 80,000 tonnes in 2024 – the country has not yet fully utilised its allocated quota. The EU plays a vital role in this sector of Ukraine’s economy: in 2024, member states purchased 87% of its total alcohol exports.
Chart 57. Ethyl alcohol imports from Ukraine to the EU, 2020–2024
Source: Eurostat.
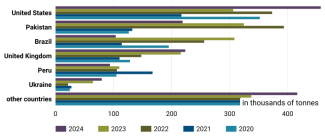
Such a substantial increase in volumes shipped to the EU has not resulted in Ukraine securing a particularly strong position in comparison with other third countries. In 2024, it accounted for just 5% of the EU’s ethyl alcohol imports.
Chart 58. Leading ethyl alcohol suppliers to the EU market, 2020–2024
Source: Eurostat.
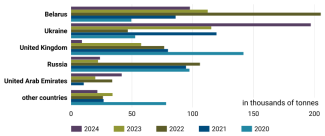
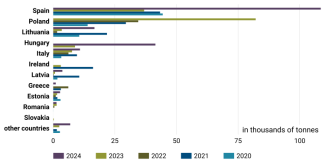
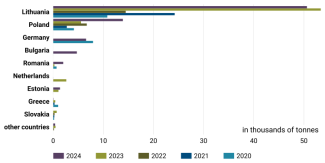
Lithuania is the largest recipient of Ukrainian ethyl alcohol. In 2024, it accounted for 63% of the total volume exported to the EU. Other notable importers include Poland, Germany, and Bulgaria.
Chart 59. Leading EU importers of Ukrainian ethyl alcohol, 2020–2024
Source: Eurostat.
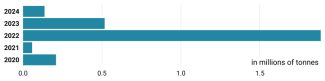
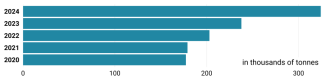
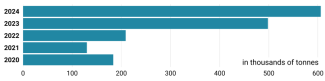
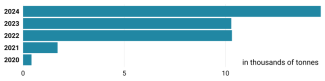
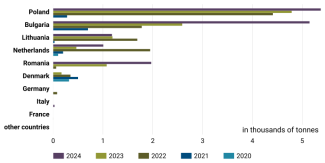
The EU is a net exporter of powdered milk. The DCFTA sets a tariff quota for this product at 5,000 tonnes per year (the European Commission has proposed increasing this to 15,400 tonnes). Once the quota is exceeded, imports are subject to a duty of €1.19 per kilogram, along with an additional charge of €27.50 per 100 kilograms net (reflecting the actual powdered milk content). Before the war, Ukraine did not make use of this quota. However, exports to the EU began to rise sharply thereafter, reaching nearly 15,000 tonnes in 2024. The EU market is extremely important for Ukraine – in 2024, it absorbed 70% of the country’s powdered milk exports.
Chart 60. Powdered milk imports from Ukraine to the EU, 2020–2024
Source: Eurostat.
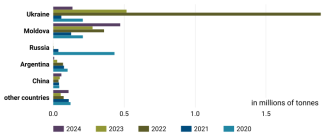
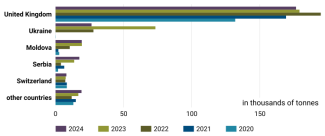
Ukraine has become the second-largest supplier of powdered milk to the EU, after the United Kingdom. In 2024, it accounted for 36% of the EU’s imports of this product from non-EU countries. Other countries played only a marginal role in this segment.
Chart 61. Leading powdered milk suppliers to the EU market, 2020–2024
Source: Eurostat.
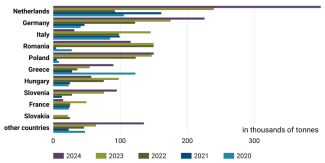
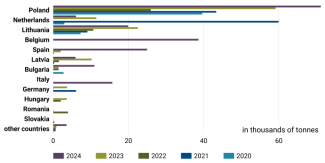
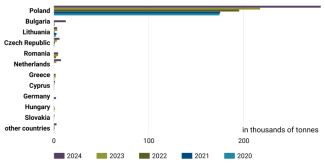
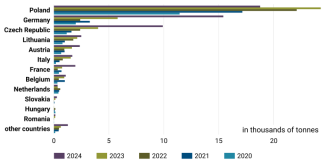
Ukrainian powdered milk was purchased primarily by Poland and Bulgaria, which together accounted for 72% of the EU’s imports of this product. In addition, sales to Romania, the Netherlands, and Lithuania were also significant.
Chart 62. Leading EU importers of Ukrainian powdered milk, 2020–2024
Source: Eurostat.
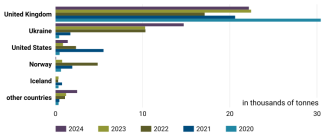
The European Union is a net exporter of wheat flour. The DCFTA sets a shared tariff quota for wheat and wheat flour at 1 million tonnes per year. Once this limit is exceeded, imports are subject to a duty of €172 per tonne. Before the outbreak of the war, Ukraine exported only negligible amounts of wheat flour to the EU. However, from 2022 onwards, exports began to grow, reaching nearly 75,000 tonnes in 2023. In the following year, owing to restrictions introduced by neighbouring countries, exports fell to 27,000 tonnes. In 2024, 39% of Ukraine’s wheat flour exports were directed to the EU market.
Chart 63. Wheat flour imports from Ukraine to the EU, 2020–2024
Source: Eurostat.
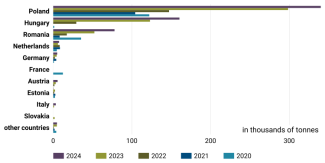
Ukraine does not play a significant role in wheat flour exports to the EU. In 2024, it accounted for less than 10% of the EU’s imports, placing it slightly ahead of Moldova and Serbia.
Chart 64. Leading wheat flour suppliers to the EU market, 2020–2024
Source: Eurostat.
After 2022, Ukrainian wheat flour began to be sold primarily to neighbouring EU countries. However, by the following year, these states began to introduce restrictions to protect their domestic markets. For example, in September 2023, Poland implemented a ban on imports of wheat milling products from Ukraine. As a result, in 2024 the main recipients of Ukrainian wheat flour were the Czech Republic, France, Germany, and Croatia.
Chart 65. Leading EU importers of Ukrainian wheat flour, 2020–2024
Source: Eurostat.
If there is no renewed blockade of Black Sea ports (which currently seems unlikely), the trend that emerged between late 2023 and early 2024 is expected to continue in the coming years. The vast majority of Ukraine’s grain exports will therefore continue to be shipped by sea, primarily to southern European countries and, to a lesser extent, the Benelux. These states use Ukrainian raw materials to support their own processing and livestock industries. Even if Ukraine’s neighbours lift import restrictions, another surge of grain into their markets is not expected, as the country’s rail logistics are now largely oriented towards the ports. The exception may be EU border regions, where the sale of grain via road transport remains economically viable.
The end of the ATM will have a limited impact on the export of Ukraine’s main agri-food products to the EU. Among cereals, only wheat exports will be seriously affected, although Kyiv is likely to find alternative markets without major difficulty. A similar situation applies to certain other products, such as sugar and poultry meat. Although the loss of part of the EU market will be painful, Ukrainian government claims that the termination of the ATM will result in losses of €3.5 billion,[4] are significantly exaggerated. Even more moderate estimates,[5] suggesting losses of around €1.5 billion, appear overstated, as they assume Ukraine will be unable to sell its production once tariff quota limits are exceeded. Yet, as early as 2024, Ukraine was already able to redirect such exports (notably sugar and poultry meat) to other markets.[6]
The situation is more complex in the dairy sector. Once quota limits are exceeded, exports to the EU become unprofitable due to high tariffs,[7] and finding alternative markets poses significant challenges. Ukrainian dairy products were delivered to the EU almost exclusively by road, while shipments to more distant destinations in the Middle East, Africa, or Asia face major logistical barriers – primarily related to maintaining cold-chain conditions during transport. An additional obstacle to entering new markets is the need to adapt production to local sanitary and veterinary standards, while securing the required certificates and permits is a time-consuming process.
A similar issue applies to processed grain products, which are now included under grain quotas. This means that even if the EU does not impose tariffs on maize after its quota is filled, products made from maize will still face the restrictions outlined in the DCFTA. As a result, the footholds Ukraine has established in the higher value-added processed foods segment will again be reduced to the quota levels set out in the agreement, which – even if increased – remain relatively limited. There is therefore no reason to expect a flood of Ukrainian processed food entering the EU market. For example, in 2024, EU member states produced 11.5 million tonnes of poultry meat, so a duty-free quota of 120,000 tonnes from Ukraine is unlikely to cause major disruption. The same applies to sugar: the EU’s internal production stands at around 16 million tonnes, while the expanded Ukrainian quota amounts to just 100,000 tonnes.
Under current conditions, it is difficult to expect a rapid expansion of the food processing sector in Ukraine. The ongoing war – the end of which remains impossible to predict – is a major obstacle, but equally important is the country’s persistently unfavourable business climate for new investment. The main issue is corruption at various levels, which imposes informal costs on businesses when obtaining construction permits, connecting to power grids and so on. Added to this is the low efficiency of the judicial system, which results in weak legal protection for entrepreneurs and exposes them to abuses by regulatory bodies and security services. Moreover, irrespective of the ongoing war, there are no signs of improvement – in fact, quite the opposite. In July 2025, the authorities in Kyiv made an unsuccessful attempt to dismantle existing anti-corruption institutions.[8] In theory, the situation could improve over the longer term if Ukraine moves towards European integration and the EU fully opens its market to Ukrainian agri-food products. If this condition is met, rapid development of the processing industry and the livestock sector – beyond poultry – cannot be ruled out, although it is far from guaranteed.
[1] OSW team, ‘Neighbourly feuds. The problem with Ukrainian grain on the Central European market’, OSW Commentary, no. 549, 26 October 2023, osw.waw.pl.
[2] S. Matuszak, J. Ber, ‘Ukraine: the new Black Sea corridor is a success’, OSW, 22 December 2023, osw.waw.pl.
[3] M. Gadawa, ‘Producenci oleju alarmują. Sytuacja „niezwykle trudna”’, Money.pl, 17 July 2025.
[4] В. Волокіта, ‘Україна втрачатиме 3,5 мільярда євро: Гетманцев про можливий розвиток торгівлі з ЄС’, Економічна правда, 16 May 2025, epravda.com.ua.
[5] V. Movchan, R. Giucci, The expiration of EU Autonomous Trade Measures for Ukraine: What’s next? – Four scenarios and implications, Institute for Economic Research and Policy Consulting, April 2025, ier.com.ua.
[6] S. Matuszak, ‘Ukraine’s trade in 2024: restoration of logistical routes’, OSW, 17 January 2025, osw.waw.pl.
[7] А. Крижний, ‘Лавочку прикрили: як ЄС зруйнував експорт української молочної продукції’, Економічна правда, 7 July 2025, epravda.com.ua.
[8] M. Jędrysiak, ‘Ukraine: Verkhovna Rada restores independence of anti-corruption bodies’, OSW, 31 July 2025, osw.waw.pl.