China-Russia Dashboard: a special relationship in facts and figures
Sino-Russian relations are closer today than they have been in decades. In these times of historic geopolitical tensions, it is all the more important to understand the nature and elements of the relationship of two of the world’s most influential powers. This dashboard aims to contribute to a better understanding by tracking and analyzing the economic, political, security, and societal dimensions of China-Russia relations and their changing quality over time. It is a collaborative research effort of the Swedish National China Centre (NKK) and the Stockholm Centre for Eastern European Studies (SCEEUS) at the Swedish Institute of International Affairs (UI),the Centre for Eastern Studies (OSW) and the Mercator Institute for China Studies (MERICS).
Jump to section
Economics
Security
Politics
Society
Economics
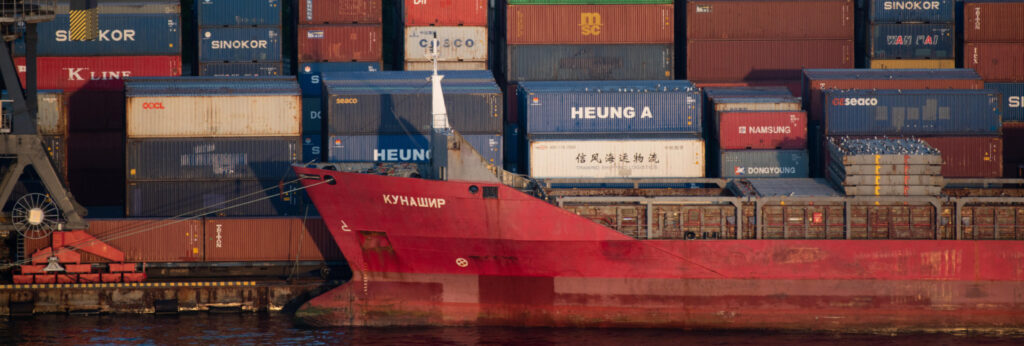
China-Russia bilateral trade has grown steadily over the last decade and has intensified since the Russian invasion of Ukraine. In 2024, total trade reached USD 245 billion, more than double that of 2020. The trade balance has been relatively even in value terms, with only a slight Russian surplus. However, it is structurally imbalanced in the types of goods traded. Russia’s exports to China mainly consist of fossil fuels and other natural resources, while China’s exports consist of manufactured goods such as cars, tractors, electronics, and other consumer products. The value of Russian exports is thus sensitive to volatile energy markets, and a large part of its increase in recent years is due to higher energy prices.
Shipments of dual-use items from China to Russia surged in late 2021, likely driven by stockpiling and year-end production peaks. Exports then fell sharply after the February 2022 invasion of Ukraine amid concerns about sanctions, but quickly recovered, remaining historically high throughout 2022 and 2023. A renewed decline occurred following the US Treasury’s announcement in December 2023 of potential secondary sanctions on entities assisting Russia’s military-industrial base. However, Chinese exports rebounded in the second half of 2024, suggesting adjustments to circumvent these restrictions. As a result, dual-use shipments from China to Russia once again exceeded USD 4 billion in 2024.
Note: The data refers to dual-use goods included in the Common High Priority List, developed jointly by the United States, the European Union, Japan, and the United Kingdom. The list categorizes 50 items, each identified by a six-digit Harmonized System (HS) code, into four tiers. The full list is available on the website of the US Bureau of Industry and Security. The values represent a 3-month moving average and have been adjusted to reflect the HS 2022 Nomenclature amendments.
Russia’s energy exports to China form the backbone of their bilateral trade, steadily increasing in both value and volume. After 2022, China’s market acted as a safety net, allowing Russia to redirect fossil fuel exports from the West. However, the slowing growth rate in 2024 highlights political and economic constraints on further expansion. Additionally, the value of these exports remains highly dependent on global energy prices.
This chart shows Russian oil exports to China surged from 2022 onwards, reaching more than 108 million tonnes in 2024 – an increase of about 30 percent since 2022. The growing share of Russian oil in China’s imports is largely a consequence of Western sanctions, which forced Russia to redirect its crude exports – even at a certain discount. While China has become a key buyer, the value of this trade remains highly sensitive to price fluctuations.
Russia’s coal exports to China have grown steadily, with a notable acceleration in 2023 due to Western sanctions. As Russian exporters lost access to EU markets, they intensified shipments to China. However, after reaching a record high in 2023, volumes declined in 2024, suggesting certain limitations on further growth due to the rise in domestic output in China and diversification of coal imports. This chart shows the volume of Russian coal exports to China in million tonnes.
Russian LNG exports to China have grown steadily, with a temporary dip in 2021 due to pandemic-related constraints. Chinese LNG imports from Russia more than tripled between 2019 and 2024, reaching a record 8.3 million tonnes. This increase aligns with China’s efforts to replace coal with gas in its energy mix.
Russia began exporting pipeline gas to China in 2019 with the launch of the Power of Siberia-1, which is set to reach its full capacity of 38 billion cubic meters per year by 2025. China has become a crucial market for Russian gas, helping to offset losses from Europe. However, despite rising exports, Russia needs additional pipelines to expand its market share further. So far, China has been hesitant to approve new projects while Moscow tries to push the project of the Power of Siberia-2 with its 50 bcm/y design capacity.
The share of Chinese yuan (CNY) in Russia’s international trade increased sharply following the February 2022 invasion of Ukraine and subsequent Western sanctions. Before the war, settlements in CNY accounted for less than 2% of Russia’s total trade but rose quickly, surpassing 30% in early 2023, then stabilizing around that level. The growth trend stopped following the US Treasury’s announcement in December 2023 that it could impose secondary sanctions on third-country entities assisting Russia’s military-industrial base. At the same time, the role of Russia’s domestic currency, the ruble, increased notably.
Security
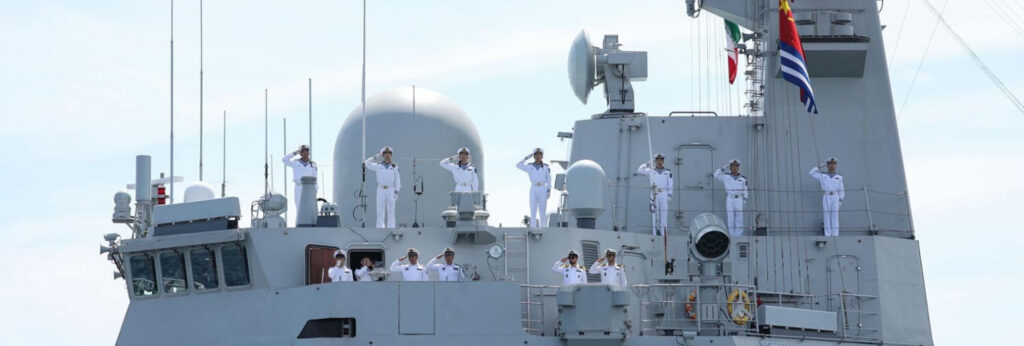
Joint Russia-China military exercises have grown significantly in number, size, complexity and geographic scope since Russia’s invasion of Ukraine. Since their first in 2003, the two countries have conducted a total of 90 joint exercises – 26 of them since February 24, 2022, accounting for nearly a third of all joint drills. In 2024 alone, they held 11 joint exercises – several more than in any previous year – as the two countries carried out ground, naval, aerial and multi-domain exercises and patrols.
During 2024, Russia and China held their first joint naval patrol in the Arctic Ocean, the first involving coast guards and a joint aerial patrol that entered the US air defense identification zone. In September 2024, China participated in Ocean-2024, Russia’s largest naval exercise since the collapse of the Soviet Union, involving more than 90,000 troops and 400 ships, spanning the Atlantic, Arctic and Pacific oceans as well as the Baltic, Barents, Japanese, Caspian, North and Mediterranean seas.
Since 2003, Russia and China have conducted over 90 joint military exercises across various domains and formats. These include ground, naval, aerial, para-military and multi-domain exercises, as well as army competitions and computer simulations. The number of exercises per year has increased in recent years, reaching an all-time high of 11 in 2024.
However, since 2022, the vast majority of joint exercises – 22 of 27 – have consisted of naval and aerial drills and patrols, accounting for all the recent growth in joint exercise activity. From their first joint naval exercise in 2009 until 2022, Russia and China conducted only a few such exercises annually. However, since 2022, they have held a total of 16 joint naval exercises – seven of which took place in 2024 alone.
Since 2019, when they conducted their first joint aerial patrol, a total of nine such patrols have been held – more than any other type of exercise except naval. The last computer simulation exercise was in 2017, the last paramilitary exercise in 2019, and the last competition in 2022. Only two ground exercises have taken place since 2017.
China has significantly reduced its arms imports from Russia in recent years. This trend is driven by China’s growing self-sufficiency in military production and has been accelerated by Russia’s declining arms exports amid the war in Ukraine. While Russian deliveries still account for the largest share of China’s arms imports (76% in 2023), their overall importance has diminished, as reflected in the decreasing volume.
Politics
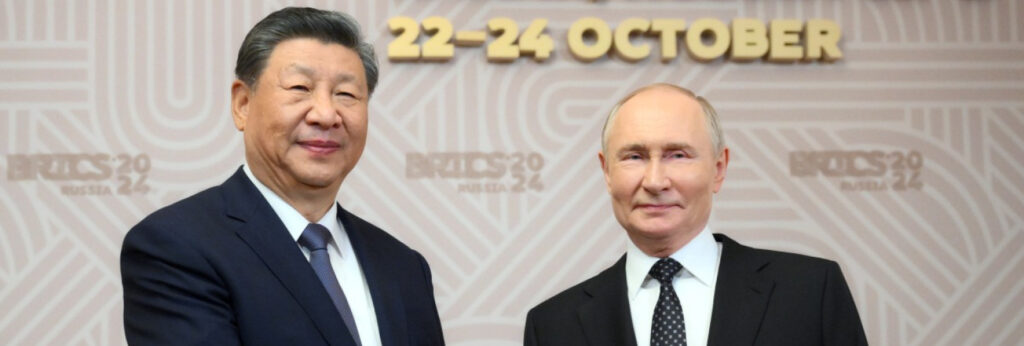
This timeline tracks China-Russia bilateral engagements in three key domains – head of state, diplomatic, and military –since the Russian invasion of Ukraine. The frequency of these interactions surpasses that of any other bilateral relationship for both China and Russia. Between February 2022 and February 2025, Xi Jinping and Vladimir Putin engaged 10 times through in-person meetings or phone calls. Top diplomats Wang Yi and Sergey Lavrov met 18 times, including bilateral visits and discussions on the sidelines of multilateral summits. Military leaders from both sides – such as Sergei Shoigu, Andrei Belousov, Zhang Youxia, Dong Jun, Li Shangfu, and Wei Fenghe – held 9 engagements during this period.
The operation of border checkpoints serves as a barometer of China-Russia bilateral relations. Traditionally, the Chinese side has been more proactive in promoting trade through these checkpoints, while the Russian side has shown more caution, primarily due to concerns over China’s growing role in the development of the Russian Far East. As a result, infrastructure improvements on the Russian side have progressed slowly. However, since Russia’s invasion of Ukraine and the end of China’s COVID lockdowns, these checkpoints have become significantly busier, with trade volumes reaching record highs. There has also been notable progress in expanding capacity to facilitate bilateral trade – for instance, the construction of bridges across the Amur River and the expansion of checkpoint facilities. The increasing activity at these checkpoints reflects a broader trend of China-Russia alignment and highlights Russia’s growing dependency on China, suggesting Moscow is now prioritizing its relationship with Beijing, while becoming less concerned about China’s influence in the development of the Russian Far East.
The graph illustrates a decline in voting alignment between China and Russia in both the General Assembly and the Security Council from 2018 to 2024. Voting coordination remains stronger in the Security Council, where the two countries did not vote in direct opposition during the measured period. When their votes differ in the Security Council, it is due to one voting in favor or against while the other abstains.
Society
The number of Chinese exchange students in Russia has grown steadily over the years, increasing from approximately 30,000 in 2020 to over 50,000 in 2024, a 72% increase. Similarly, Chinese students have accounted for a growing share of all foreign exchange students in Russia, rising from 9.4% in 2020 to 13.6% in 2024. As a result, China has surpassed other countries and is now the third-largest country of origin – its student numbers nearly matching those of the top two, Kazakhstan and Turkmenistan.
While Chinese students at the bachelor’s level make up the largest group in absolute numbers, China is by far the leading country of origin for master’s students. In 2024, its 16,411 master’s students represented approximately 36% of all master’s students in Russia.
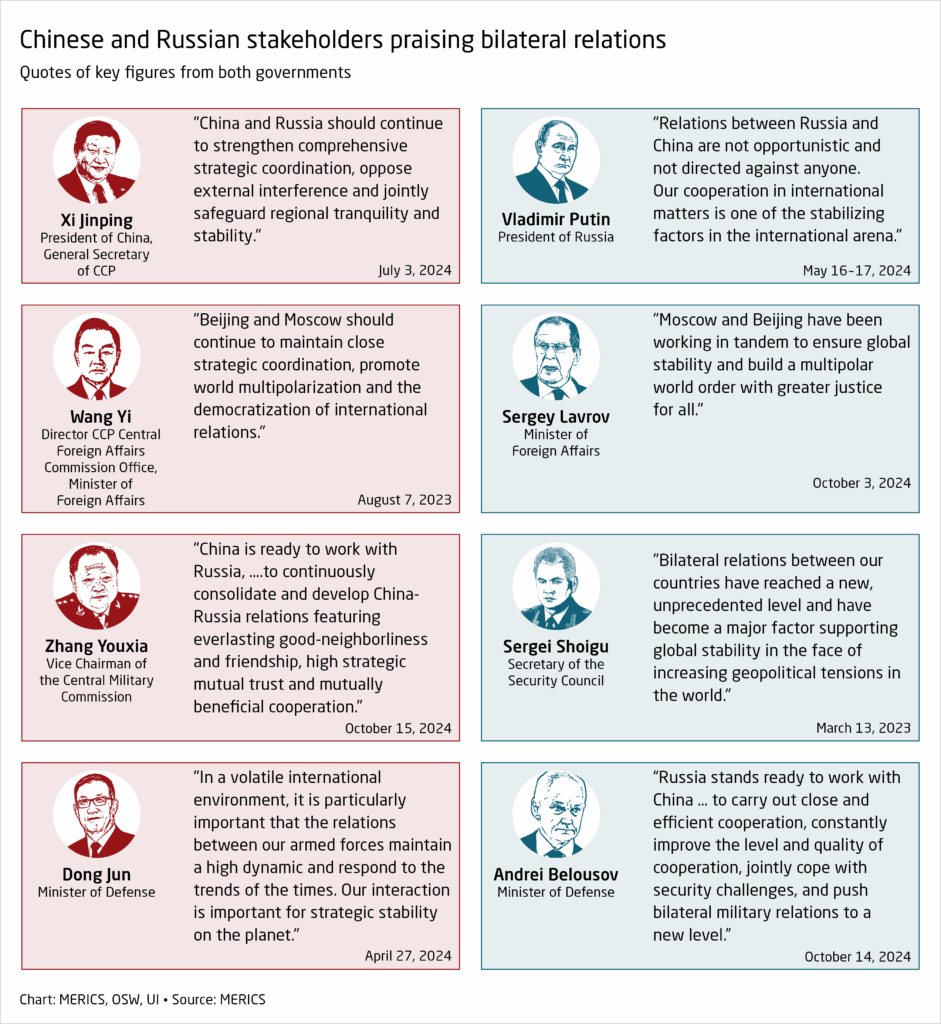
Key figures in China-Russia bilateral relations indicate a closer alignment across various domains, highlighting stronger strategic coordination in political narratives and military cooperation. Both Xi Jinping and Vladimir Putin have set the tone for these relations, not only based on their respective geopolitical positions but also by promoting a shared worldview and ambition to build an alternative global order – one in which China and Russia play a greater role as stabilizing powers. This ambition is further articulated by their chief diplomats, Wang Yi and Sergey Lavrov, who emphasize the goal of establishing a multipolar world order and the democratization of international relations. Military leaders from both sides have also called for deeper cooperation, aiming to enhance stability not only between China and Russia but also within the broader global system.
The number of tourist visits between Russia and China grew steadily for years, peaking in 2019 with nearly 1.9 million Russian visits to China and over 2.3 million Chinese visits to Russia. However, tourism between the two countries collapsed during the COVID-19 pandemic and further declined following Russia’s full-scale invasion of Ukraine in 2022, with visits dwindling to just a few thousand in 2021 and 2022.
In 2023, tourism rebounded significantly in both directions, though it remained far below pre-pandemic levels – less than a third of the peak recorded in 2019. As a share of total tourist visits to Russia, Chinese tourist visits peaked at 7.7% in 2019, plummeted to 0.3% in 2021 and 2022, and recovered to 5.8% in 2023.